

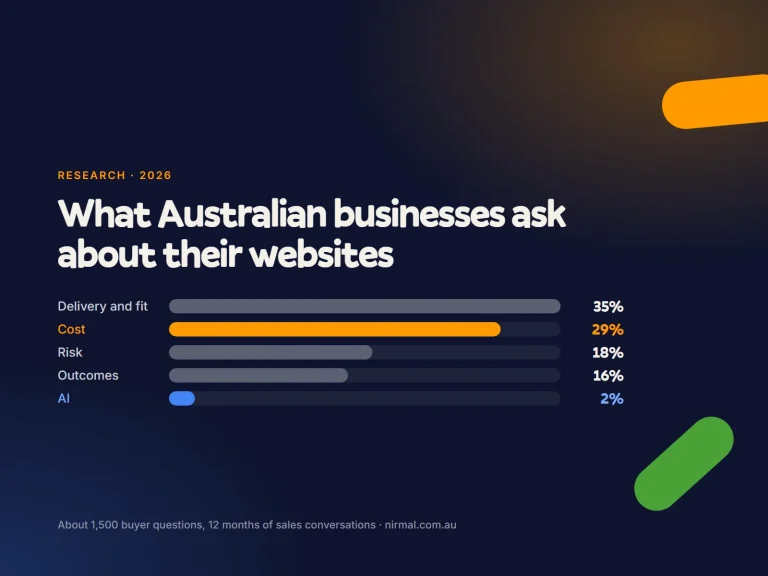
What Australian businesses ask about their websites in 2026: an analysis of about 1,500 questions from 12 months of real sales conversations.
Cost was mentioned much more often than proving value in this one-agency question bank. The counts do not show which question came first in a conversation or what buyers already knew. This report describes the recorded patterns, compares them with external research and separates my interpretation. Data period: October 2025 to October 2026. Original field-source check: 20 October 2026; the updates below were checked 26 October.
Key findings
- Across about 1,500 questions Australian businesses asked a web agency between October 2025 and October 2026, cost came up 13 times more often than AI: 29% of all questions against 2% (Nirmal Gyanwali, What Australian businesses ask about their websites, 2026).
- The most-asked question was “How much does a custom website cost?” (about 45 times), and the most-asked question that was not about money was “Do I need a new website, or can you fix the one I’ve got?” (about 28 times) (Gyanwali, 2026).
- Questions about proving a website’s value, such as building the business case for a board or measuring return, made up about 2% of all questions, even though measuring marketing ROI is the top challenge marketers report (33%, HubSpot, 2026) and only 7% of Australian businesses measure what digital activity contributes to performance (ABS, 2024-25).
- Conversion, speed, AI visibility and ownership together accounted for about 12% of buyer questions, less than half the share taken by cost (Gyanwali, 2026).
- “How do I show up in ChatGPT and AI search?” was the most-asked AI question, at about 9 times in 12 months, while 43% of Australian SMEs reported adopting AI in some form (National AI Centre, December 2025 to February 2026).
How I researched this
I analysed the existing buyer-question bank compiled for WP Creative, the web agency I founded in 2016. The bank describes a source base of 48 full call transcripts, about 600 call summaries and about 150 website enquiries and inbound emails, covering October 2025 to October 2026. Its source and counting limitations are stated below.
Duplicates were merged into 194 distinct questions in 17 themes, with approximate frequency weights totalling about 1,497 coded occurrences. Those are not 1,497 independent buyers or timestamped conversations. Counts are directional; the original one-year method and limitations remain below.
What do Australian businesses ask most about their websites?
Pricing and ongoing support were the most frequent themes. Pricing and budget (~195) and support plans (~189) together account for about a quarter of the coded occurrences. Rebuilds and migrations rank third (~133), followed by SEO, AI search and marketing (~117). AI and the future of websites is the smallest of 17 themes (~16). This is a frequency order, not the sequence of a call.
| Rank | Theme | Distinct questions | Approx. times asked | Share of all questions |
|---|---|---|---|---|
| 1 | Pricing and budget | 19 | ~195 | 13.0% |
| 2 | Ongoing support plans and retainers | 18 | ~189 | 12.6% |
| 3 | Rebuild, redesign and migration | 14 | ~133 | 8.9% |
| 4 | SEO, AI search and marketing | 16 | ~117 | 7.8% |
| 5 | Process, timeline and team | 15 | ~112 | 7.5% |
| 6 | Platform choice | 12 | ~97 | 6.5% |
| 7 | One-off jobs and small budgets | 8 | ~89 | 5.9% |
| 8 | Security, hacks and maintenance | 12 | ~88 | 5.9% |
| 9 | Hosting and ownership | 10 | ~78 | 5.2% |
| 10 | Conversion, leads and ROI | 11 | ~67 | 4.5% |
| 11 | Trust, proof and switching agencies | 12 | ~66 | 4.4% |
| 12 | Speed and performance | 8 | ~59 | 3.9% |
| 13 | Ecommerce and integrations | 10 | ~58 | 3.9% |
| 14 | Agency partnerships | 10 | ~55 | 3.7% |
| 15 | Contracts and commitment | 5 | ~39 | 2.6% |
| 16 | Enterprise, tenders and compliance | 9 | ~39 | 2.6% |
| 17 | AI and the future of websites | 5 | ~16 | 1.1% |
| Total | All 17 themes | 194 | ~1,497 | 100% |
What are the 25 most-asked questions?
Twelve of the 25 most-asked questions are about cost. The rest are about whether to fix or rebuild, who runs the site after launch, and whether the buyer can trust the next supplier more than the last one. Questions are paraphrased the way buyers ask them; “you” is the agency.
| # | Question, as buyers ask it | Approx. times | Theme | Lens |
|---|---|---|---|---|
| 1 | How much does a custom website cost? | ~45 | Pricing and budget | Cost |
| 2 | What does an ongoing website support plan cost, and what do I get for it? | ~38 | Ongoing support plans | Cost |
| 3 | Do I need a new website, or can you fix the one I’ve got? | ~28 | Rebuild and migration | Delivery and fit |
| 4 | Can you just do a one-off fix? We don’t want a monthly plan. | ~26 | One-off jobs | Cost |
| 5 | Do you do SEO? | ~26 | SEO, AI search and marketing | Outcomes |
| 6 | Our budget is small. Can we still get a proper website built? | ~24 | Pricing and budget | Cost |
| 7 | Do you lock me into a long contract? | ~22 | Contracts | Risk |
| 8 | Isn’t an ongoing support plan just website maintenance? | ~18 | Ongoing support plans | Cost |
| 9 | What’s your hourly rate? | ~18 | Ongoing support plans | Cost |
| 10 | Do you host websites? | ~18 | Hosting and ownership | Delivery and fit |
| 11 | Is there anything cheaper than the entry-level plan? | ~16 | Ongoing support plans | Cost |
| 12 | Can you recommend someone cheaper? | ~16 | One-off jobs | Cost |
| 13 | My website has been hacked. Can you fix it? | ~16 | Security | Risk |
| 14 | Why is my website so slow? | ~16 | Speed | Outcomes |
| 15 | Will a new website hurt my Google rankings? | ~16 | Rebuild and migration | Risk |
| 16 | Can you take over a website another agency built? | ~16 | Rebuild and migration | Delivery and fit |
| 17 | Should I use WordPress or Shopify for my online store? | ~16 | Platform choice | Delivery and fit |
| 18 | How long does a new website take? | ~15 | Process and team | Delivery and fit |
| 19 | Can you give me a ballpark price on this first call? | ~14 | Pricing and budget | Cost |
| 20 | Can you move my site from Wix, Squarespace or a custom CMS to WordPress? | ~14 | Rebuild and migration | Delivery and fit |
| 21 | Do you run Google Ads or do marketing? | ~14 | SEO, AI search and marketing | Delivery and fit |
| 22 | Will my team be able to edit the website themselves? | ~13 | Platform choice | Delivery and fit |
| 23 | Can you reduce the scope to fit our budget? | ~12 | Pricing and budget | Cost |
| 24 | What does an ecommerce website cost? | ~12 | Pricing and budget | Cost |
| 25 | What’s the difference between the support plan tiers, and which one do we need? | ~12 | Ongoing support plans | Cost |
Six questions tie at about 12; the three shown keep the source’s order. The top 25 account for about 481 of the 1,497 questions (32%). All 194 are in the CSV.
How much of what buyers ask is about cost, outcomes, risk or AI?
Cost is 29% of what buyers ask; AI is 2%. I gave each of the 194 questions one lens: what is the buyer really asking about? Cost questions outnumber outcome questions nearly two to one, and AI questions 13 to one.
| Lens | What it covers | Distinct questions | Approx. times asked | Share |
|---|---|---|---|---|
| Delivery and fit | Process, timelines, platforms, team, capability, partnerships | 66 | ~518 | 34.6% |
| Cost | Price, budget, rates, payment terms, plan cost, cheaper options | 44 | ~439 | 29.3% |
| Risk | Security, lock-in, ownership, losing rankings, trust, compliance | 41 | ~270 | 18.0% |
| Outcomes | Rankings, traffic, leads, conversion, speed, ROI, reporting | 34 | ~236 | 15.8% |
| AI | Any question that names AI, ChatGPT or AI search | 9 | ~34 | 2.3% |
Two ways of counting give the same answer. By the source’s own themes, pricing and budget (~195) outnumbers AI and the future of websites (~16) by 12 to one. By lens, cost (~439) outnumbers every question that names AI (~34) by 13 to one.
Are businesses asking about AI and their websites yet?
Barely, and this dataset cannot yet say whether that is changing. Nine of the 194 distinct questions mention AI, and together they came up about 34 times in 12 months. The questions were not time-stamped, so I can’t tell you whether AI questions rose through the year. I can tell you what people asked.
| AI question, as buyers ask it | Approx. times | Kind of question |
|---|---|---|
| How do I get my business to show up in ChatGPT and AI search? | ~9 | Visibility |
| Do you use AI in how you build websites? | ~5 | How sites are made |
| Can you add an AI chatbot or product finder to our site? | ~5 | Features |
| I edit my own site with AI now. Do I still need an agency? | ~3 | How sites are made |
| Will AI make websites cheaper to build? | ~3 | How sites are made |
| Do I need to rebuild my website for AI search? | ~3 | Visibility |
| Should we use AI to write our website content? | ~2 | How sites are made |
| Does gated content hurt our SEO and AI visibility? | ~2 | Visibility |
| Is a website built with AI coding tools secure? | ~2 | How sites are made |
Three signals stand out:
- Production and visibility are both present. The classification puts about 15 AI occurrences in production questions,14 in visibility and 5 in features. Those approximate weights do not justify treating a difference of one as a meaningful preference.
- The coding affects the AI count. General SEO questions can include AI-related variants, while the lens is assigned to each distinct question rather than every underlying occurrence. Read the AI bucket as a directional classification, not a precise measure of all interest in AI visibility.
- Marketing managers carry the AI questions. They are listed on six of the nine. Business owners ask the “will AI make it cheaper” and “do I still need an agency” versions.
In other populations, AI use is common. Pew’s February 2026 survey of 5,119 US adults found 49% had used AI chatbots and 42% used them to search for information. 6sense’s 2025 global B2B study found 94% used LLMs in buying; its sample concerned larger purchases, with a $25,000 eligibility minimum. Neither estimates AI use among this question bank’s buyers.
The National AI Centre’s December 2025 to February 2026 SME Pulse reported 43% had adopted AI to some extent; each monthly wave surveyed at least 400 decision-makers. The ABS 2024-25 release reported 12% business use. The periods, questions and populations differ. In our bank, explicit website-AI questions are relatively infrequent; that does not establish what all Australian businesses know or do.
What do buyers need to prove to their boards?
Proving value is a relatively small part of the recorded questions. Six questions about business cases, measurement and reporting total about 34 occurrences, around 2% of the bank. That does not show whether buyers understood ROI already, discussed it elsewhere or were asked about it by the seller.
| Question about proving value | Approx. times | Who asks |
|---|---|---|
| Can you help me build the business case for my board or CEO? | ~8 | Marketing managers, not-for-profits, enterprise |
| How do you measure ROI on website work? | ~7 | Marketing managers, owners, enterprise |
| What would a new website need to make to be worth it? | ~5 | Owners, marketing managers |
| What does it cost me to wait for a new website? | ~5 | Owners, marketing managers |
| How do I prove website ROI to my CEO or board? | ~5 | Marketing managers, not-for-profits |
| Do you send monthly reports? | ~4 | Marketing managers, enterprise |
The patterns behind these questions, paraphrased:
- The board sees the website as a cost line. Buyers describe needing numbers to justify the spend internally, and a boss who “needs to see the numbers”.
- Buyers ask how they will know it is working and which KPIs get reported. The aggregate bank cannot establish whether that happened before or after price was discussed.
- The board question mostly comes from the seller. “What metrics do you need to report to your board?” is a standard discovery question the agency asks on these calls. From the buyer’s side, the board came up in only two questions, about 13 times in a year.
This matches the wider data. Measuring marketing ROI is the top challenge marketers report (33%), and 73% say their budget gets more scrutiny than before (HubSpot, 2026, 1,500+ marketers).
In Australia, only 7% of businesses measured the contribution of digital activity to overall performance in 2024-25, up from 3% in 2021-22 (ABS). The pressure to prove value is real. The habit of measuring it is not there yet.
Who asks what?
The balance of recorded questions differs by buyer type. Each distinct question lists up to three types. The shares give every listed type the question’s full count, so they are overlapping coded emphases, not head counts or the order in which buyers ask.
| Buyer type | Listed on (of 194) | Cost | Outcomes | Risk | AI | Delivery and fit | Most-asked themes |
|---|---|---|---|---|---|---|---|
| Business owner | 116 | 31% | 15% | 19% | 2% | 33% | Support plans, pricing, rebuilds |
| Marketing manager | 112 | 25% | 19% | 17% | 2% | 36% | Support plans, pricing, rebuilds |
| Enterprise or procurement | 45 | 34% | 7% | 26% | 2% | 31% | Support plans, pricing, tenders and compliance |
| Ecommerce owner | 39 | 36% | 23% | 18% | 2% | 22% | Pricing, ecommerce and integrations, speed |
| Not-for-profit | 28 | 30% | 9% | 13% | 1% | 47% | Pricing, platform choice, support plans |
| Agency partner | 27 | 40% | 2% | 20% | 4% | 34% | Partnerships, support plans, contracts |
What the table says:
- Marketing-manager questions are more outcome-weighted than business-owner questions:19% against 15%. They also have the lowest cost share shown,25%. Those are descriptive tags; the bank cannot establish why each person asked.
- Ecommerce owners have the highest cost and outcome shares among end-client types shown:36% and 23%. Agency partners have a higher cost share overall,40%. Speed also appears among ecommerce’s leading themes; the table does not measure the revenue each buyer loses.
- Enterprise and procurement buyers ask about risk most (26%): certification, NDAs, vendor questionnaires, transitions between suppliers.
- Not-for-profits ask how, not what for. Nearly half their questions are about platforms, editability and process; only 9% are about outcomes.
How do buyers describe a website that is failing?
They describe symptoms, not causes, and almost never in dollars. Across the question variants, the language of a failing website falls into eight patterns. Phrases are paraphrased.
| Pattern | Related questions, approx. times | How buyers put it (paraphrased) |
|---|---|---|
| Outgrown | ~42 | “Is our site even worth saving?”, “we’ve outgrown our builder”, “our custom CMS is a nightmare” |
| Leaking | ~26 | “Plenty of visitors, no leads”, “lots of traffic, not enough sales”, “our ads aren’t converting” |
| Trapped | ~25 | “We can’t edit our own site”, “only one developer understands it”, “they won’t give us the logins”, “the agency won’t hand it over” |
| Slow | ~16 | “It takes forever to load”, “mobile is painfully slow”, “our speed score is terrible” |
| Unsafe | ~16 | “We’ve got spam pages”, “Google is warning people our site is dangerous” |
| Invisible | ~16 | “We’ve vanished from Google”, “our traffic halved”, “we lost half our traffic after the new site” |
| Unfinished | ~11 | “We paid for a site that was never finished”, “our developer disappeared” |
| Fragile | ~9 | “Every update breaks something”, “our changes keep disappearing”, “it falls over on launch days” |
Related-question counts sum the questions where each pattern appears (for example, “Outgrown” is the fix-or-rebuild question plus the platform-migration question). They overlap with the lenses above and should be read as a ranking.
Two things stand out. First, “trapped” comes up more often than “slow”: buyers who can’t edit, can’t log in or can’t leave. (That count includes the forward-looking “will my team be able to edit it?” question, about 13 of the 25.)
The paraphrased bank often describes symptoms such as “no leads” without a quantified loss. A summary may omit commercial context, so that does not prove buyers never measured it. My practical recommendation is to estimate the impact and agree how a proposed fix will be evaluated.
What do buyers rarely ask, but should?
This section is my opinion, informed by the data. These question groups appear between about 2 and 18 times, compared with about 195 for pricing and budget. Some are phrased as existing problems. I would include them in a buying brief, while recognising that the bank does not rank their causal importance or record the order of discussion.
| The question buyers should ask | How often it came up | Why it matters |
|---|---|---|
| What must this website earn, and how will we know? | ~5 to ~7 | Without a target, every quote looks expensive and nothing can be judged a success |
| What does waiting cost us? | ~5 | The old site keeps losing leads while the new one is planned |
| Who owns the domain, hosting, code and analytics? | ~9, plus ~9 more from people already locked out | Ownership is cheap to settle at the start and expensive to fight for later |
| Can AI assistants find, read and cite us? | ~14 across all visibility questions | 68% of US Google searches now end without a click (SparkToro, 2026) |
| What happens after launch, and who owns it? | ~6 | Most of a website’s life, and most of its risk, comes after launch day |
| Is it accessible? | ~4 | Accessibility is a legal, ethical and commercial risk for every public site |
| If AI built it, who checked it? | ~2 | AI writes code fast; fast code isn’t always reviewed code |
What I think this means
Opinion: this is my view as a founder and engineer, not a finding.
The gap: buyers ask about price; results depend on four other things
Price is a fair question. My recommendation is to agree the business objective alongside it. Cost represents 29% of the coded occurrences; conversion, speed, AI visibility and ownership together account for about 12%. Frequency does not tell us which was discussed first or which factor caused the purchase decision.
I have built websites since 2005 and run WP Creative since 2016. My interpretation is that a clear commercial target makes supplier quotes easier to judge. The bank does not prove buyers lacked a target, or that this was why they asked about price.
In my team’s work, the practical brief often includes conversion, integrations, maintenance and migration as well as design. I would ask about those dependencies in discovery. That is experience informing my recommendation, not a second statistical dataset proving what buyers think.
Three parts of the gap worry me most:
- Ownership. Contract lock-in questions (~22) are more frequent than the explicit hacked-site question (~16). The bank includes both ownership planning and existing access problems; it cannot establish that ownership was mostly discussed after a lockout. Put account control, code rights, licences and exit responsibilities in the brief and contract.
- Conversion and speed. “Why is my website so slow?” is a top-15 question. The 55/Deloitte study commissioned by Google analysed 37 European and US brands over 30 days at the end of 2019. Improvements of 0.1 seconds across four mobile-speed metrics throughout the journey were associated with 8.4% higher retail and 10.1% higher travel conversion. That historical association is not a promised lift for one fix. When acquisition is expensive, measuring the post-click experience is a sensible commercial priority.
- AI visibility. About 14 explicit visibility asks were recorded. In Pew’s March 2025 tracked sample of 900 US adults, traditional-result clicks occurred on 8% of visits with an AI summary versus 15% without; summary-source clicks occurred on 1%. Ahrefs’ February 2026 observational study associated AI Overviews with 58% lower position-one desktop CTR, comparing December 2023 and 2025. These are different studies and markets, not a forecast of this site’s traffic.
What should change in how businesses buy websites in 2027
- Write the brief as a number. Before asking any supplier for a price, write down what the website must earn or protect in the next 12 months: qualified enquiries, online revenue, admin hours saved, risk removed. Then every quote can be compared against the same target.
- Diagnose before you rebuild. “Fix or rebuild?” is the most-asked question that isn’t about money. Ask for a diagnosis of the current site, backend included, before you accept a rebuild quote. Stabilise before you optimise.
- Put ownership in the contract. Domain, hosting, code, analytics and ad accounts in your business’s name, with your supplier added as a user. It costs nothing at the start.
- Set three baselines on day one: speed (Core Web Vitals on mobile), conversion (enquiries or sales per visit), and AI visibility (are you named in ChatGPT, Gemini and Google’s AI answers for your ten most important buying questions?). If a supplier can’t measure them, they can’t improve them.
- Budget for the run, not just the build. The website’s life starts at launch. Agree in the same conversation who owns updates, security, testing and improvement in year two.
- For anything built with AI, ask who signs off the risk. Faster drafting or coding still needs named human review, testing, permissions and accountability. The question bank does not measure a tenfold productivity or safety improvement.
- Compare quotes on scope, not totals. Two quotes for “a website” are usually two different jobs. Comparing them on price alone is comparing apples with pears.
I want the next edition to make outcome questions easier to track. That requires the prospective event-level method below; a change in a future bank would still need comparable capture and coding before being treated as a trend.
Where the evidence disagrees
- AI use is high in surveys, but AI barely shows up in website questions. 43% of Australian SMEs report adopting AI (National AI Centre) and 94% of B2B buyers use LLMs in research (6sense), yet AI is 2% of what buyers asked. The official Australian figure is much lower: 12% of businesses used AI in 2024-25 (ABS). These estimates use different populations, definitions and periods, so they are not directly comparable. Using AI at work is also not the same as worrying about AI and your website.
- Search behaviour and measured referrals answer different questions. SparkToro’s January to April 2026 US Similarweb-panel analysis estimated 68.01% zero-click Google searches. Ahrefs’ September 2026 panel of 115,254 selected sites attributed 0.43% of visits to AI assistants and 23.96% to Google. These are not Australian-market totals, and referrer counts do not measure every earlier influence on a purchase.
- The speed evidence is strong but dated. The 0.1-second study was commissioned by Google, used data from 2019 and improved four metrics together, so it shows the direction, not a guaranteed lift for any one site.
- The board pressure is measured globally, the gap locally. HubSpot’s ROI finding comes from a vendor survey of 1,500+ marketers worldwide. The ABS 7% figure is Australian and official, but measures something broader than websites.
- Cost emphasis may reflect sales-stage bias. In 6sense’s 2025 larger-purchase B2B study, first seller contact averaged 61% through the journey and 95% bought from a day-one shortlist. It also found LLM use had not replaced vendor interactions. That suggests questions worth investigating, not proof of why our buyers asked about price. An earlier-stage sample could differ.
Methodology and limitations
Data. All buyer questions recorded in WP Creative’s sales conversations from October 2025 to October 2026: 48 full call transcripts, about 600 call summaries and about 150 website enquiries and inbound emails, with mostly Australian businesses and organisations. WP Creative is a web agency I founded in 2016; it builds and runs websites, mainly on WordPress.
Extraction. Buyer questions were pulled from each source. Duplicates and rephrasings were merged into 194 distinct questions, each with its common variants, and grouped into 17 themes.
Counting. Each distinct question carries an approximate count of how often it, or one of its variants, came up across the sources. Counts are rounded and marked “~”. The source labels them directional (“treat them as a ranking, not a statistic”), and so do I.
Bands: High is 15 or more (18 questions), Medium 6 to 14 (97), Low 5 or fewer (79). I summed the counts to get the total of about 1,497. Some double counting is possible, for example where a call has both a transcript and a summary.
Tracing. The question bank was built on 8 October 2026 to help a sales team, not as a research instrument. It keeps no event-level log linking each count to the conversation it came from, so the counts cannot be re-traced one by one. Read every number in this report as one agency’s coded question occurrences, not a survey of Australian businesses.
Lenses (my classification). I gave each question one lens: Cost, Outcomes, Risk, AI or Delivery and fit. Any question that names AI is AI, whatever else it is about. The lens for every question is in the CSV, so anyone can re-classify it and check the shares.
Buyer types. Taken from the source, which lists up to three buyer types per question. In the buyer-type table, each listed type gets the question’s full count.
Field context. The original edition linked ten primary sources checked 20 October 2026. Material contextual claims were rechecked 26 October. Each study retains its own date, population and measure: for example, the ABS 7% digital-contribution measure is broader than websites, and the 6sense study concerns larger B2B purchases. These sources provide context, not validation of this agency’s approximate frequency counts.
Anonymisation. No client, prospect or partner names, no call identifiers, no identifiable quotes (all buyer language is paraphrased), no prices and none of WP Creative’s answers. One theme was renamed so no product name appears.
Limitations.
- One company’s pipeline. These are people who contacted one Australian web agency known for WordPress and ongoing support. The “ongoing support plans” theme is inflated because that is what the company sells.
- Sales-stage bias. Questions asked on sales calls lean towards price, scope and terms.
- Approximate counts. Directional only; the ranking is more reliable than any single number.
- No time stamps. The data cannot show whether any theme, including AI, rose or fell during the year.
- No industry tags. The question bank records buyer types, not industries, so this edition reports no industry patterns.
- Questions recorded, not questions intended. A summary may drop a question that a transcript would have kept.
- A sales tool, not a research instrument. The bank was built to help a sales team answer well. This report re-uses it with that caveat.
Next edition (2027). Time-stamp every question by quarter, tag industry, count each question once per conversation, and keep an event-level log so every count can be traced to its source.
Data download. The theme, lens, buyer-type and question counts behind every table: Download the data (CSV, CC BY 4.0).
Cite and reuse this research
Cite this report
Gyanwali, N. (2026). Australian businesses ask about website cost 13 times more than AI: What Australian businesses ask about their websites in 2026. nirmal.com.au. https://www.nirmal.com.au/what-australian-businesses-ask-about-websites-2026/
Cite a table: “Source: Nirmal Gyanwali, What Australian businesses ask about their websites, 2026, nirmal.com.au.”
Licence. The tables and data in this report are licensed CC BY 4.0. Reuse them, including commercially, with credit to “Nirmal Gyanwali, nirmal.com.au” and a link to this page.
Method first. The data, sample, period and limitations are stated above. Where a number is directional, it says so. If you find an error, tell me and I’ll fix it and note the change on this page.
Corrections. 25 October 2026: the lead-in to “What do buyers rarely ask, but should?” said those questions came up five times or fewer. Several rows in its table were higher, so the sentence now gives the actual range. No figure in any table changed.
26 October 2026 update. Clarified coded occurrences versus buyers, removed unsupported conversation-order and motive inferences, corrected buyer-type comparisons and tightened external study populations, dates and causal limits. The 194-question dataset, approximate frequency weights, tables and original one-year method were retained.
For journalists, writers and podcast hosts. I’m happy to comment on the findings, share the underlying method, or talk about what they mean for Australian businesses. Get in touch.
Next study: how agent-ready Australian websites are, from public website scans run with PostCliq, the product I built. Ask for the early results.
If you want a team to do this work for you, that’s what I built WP Creative for.